Employer health premiums quietly reduce take-home through pre-tax payroll deduction. The honest math across HDHP+HSA, PPO, HMO, and the self-employed ACA case for 2026.
Sources cited
2026 data
Updated June 2026
'IRS · BLS · SSA'
Healthcare Premium Impact on Real Take-Home Pay 2026
Independent Salary Data Researcher
Published May 21, 2026
Updated Jul 21, 2026
Maintained by the author using IRS Publication 15-T, SSA wage-base announcements, and BLS OEWS data.
All calculator formulas are deterministic JavaScript — no AI inference in the numbers.
Content is reviewed for accuracy when tax figures are updated annually. See Methodology · Author Profile
A salary number on an offer letter is not the number that lands in a checking account.
Health insurance premiums are one of the largest gaps between gross and net for US workers,
and the math is more interesting than the deduction line on a paystub suggests. Premiums
come out pre-tax, which softens the blow, but the choice between plan types — HDHP with
HSA, PPO single, PPO family, HMO — produces real take-home differences of several thousand
dollars per year for the same nominal salary. This guide walks through the honest math for
2026, including the self-employed ACA marketplace case where the pre-tax structure does not
apply.
Source data: IRS Publication 502 for medical-expense rules, IRS Publication 969 for HSA
and FSA contribution limits, KFF Employer Health Benefits Survey for premium ranges,
HealthCare.gov for marketplace benchmarks, and ASPE federal poverty level tables for
subsidy thresholds. Citations are inline and at the end of the guide.
What this guide is. A structural breakdown of how health premiums
interact with payroll tax and HSA contributions to shape real take-home pay.
What it is not. A plan recommendation, a benefits-enrollment guide,
or a substitute for talking to your HR department or a licensed insurance broker about
a specific plan year.
The Math: Pre-Tax Premium vs Take-Home Reduction
Pre-taxEmployer premiums reduce FICA + income tax base
$4,4002026 HSA individual contribution limit
~$500+Annual take-home difference between plan types
Employer-sponsored health premiums almost always run through a Section 125 cafeteria plan.
The mechanical effect: the premium dollars are deducted from gross pay before federal income
tax, before state income tax in most states, and before FICA (Social Security and Medicare).
The W-2 Box 1 wage figure is reduced by the annual premium, and so is the FICA-eligible
wage base. That is why the line on a paystub for "medical premium" looks small relative to
the headline annual cost — taxes are already netted out.
The clean way to think about it: the real reduction in take-home is the stated premium
multiplied by one minus the household's combined marginal rate on that dollar. For a
single filer at $80,000 of W-2 wages with a 22% federal marginal bracket, no state income
tax, and the full 7.65% FICA exposure, the combined marginal rate on the next dollar of
pre-tax payroll is roughly 29.65%. A $400 monthly premium ($4,800 annual) reduces actual
take-home by about $4,800 × (1 − 0.2965) = $3,377 per year Illustrative. The other $1,423 is tax that
would have been paid anyway and is now sheltered.
The same $4,800 of post-tax cost — for example, an individual marketplace premium without
a subsidy — comes straight out of after-tax dollars. The all-in pre-tax-equivalent cost is
$4,800 / (1 − 0.2965) ≈ $6,824 of gross wages. That gap, $2,024 per year on a $4,800
premium, is the structural value of employer-sponsored coverage independent of any
employer subsidy of the premium itself.
The Four Common Plan Types Compared
Premiums vary widely by employer, region, and plan year. The figures below reflect typical
employee-paid portions for a worker earning around $80,000 at a mid-sized US employer in
2026, drawing on KFF Employer Health Benefits Survey ranges EstimatedKFF 2025 EHBS. Treat them as illustrative anchors, not quotes.
Plan
Employee premium
Deductible
HSA-eligible
Best fit
HDHP single + HSA
~$200/mo
$1,650+
Yes ($4,400 limit)
Healthy single, savers
PPO single
~$400/mo
$500–$1,500
No
Frequent care, specialists
PPO family
~$1,400/mo
$1,000–$3,000
No
Families with kids
HMO single
~$300/mo
$500–$2,000
Sometimes
Narrow network OK, lower premium
The headline difference between HDHP and PPO at the single-coverage level is roughly $200
per month in employee premium, or $2,400 per year. That is the visible piece. The hidden
piece is the HSA, which only the HDHP route unlocks and which can move the comparison by
another $1,000 to $2,000 per year on the tax side alone.
The HSA Triple-Tax Advantage
A Health Savings Account stacked on an HDHP is one of the few accounts in the US tax code
with three layers of advantage at the same time:
Pre-tax contribution. Payroll-routed HSA contributions reduce federal
income tax, state income tax in most states, and FICA. Direct contributions made outside
payroll reduce federal and most state income tax but not FICA.
Tax-free growth. Investment gains inside the HSA are not taxed.
Tax-free qualified withdrawal. Withdrawals for qualified medical
expenses, current or reimbursed years later, are not taxed.
The 2026 HSA contribution limits are $4,400 for single coverage and $8,750 for family
coverage, with an additional $1,000 catch-up contribution allowed at age 55 or older.
Funding $4,400 through payroll at a 22% federal marginal rate, 5% state rate, and 7.65%
FICA reduces total tax by roughly $4,400 × 0.3465 ≈ $1,525. That is real cash, returned
either through reduced withholding during the year or through a refund the following
April depending on how W-4 settings were configured.
The structural effect on plan choice: a fully funded HSA can reduce the effective cost of
an HDHP by more than the premium difference between HDHP and PPO. For a single saver who
would otherwise hold $4,400 in a taxable account anyway, the HDHP+HSA route often wins
even before the lower premium is counted.
FSA vs HSA: When Each Wins
Flexible Spending Accounts and Health Savings Accounts are sometimes confused on a benefits
enrollment screen. They behave differently and the choice locks in for a plan year.
FSA. 2026 limit is $3,300. Contributions are pre-tax, including FICA.
The use-it-or-lose-it rule still applies, with employer-permitted carryover up to $660
into the next year, or alternatively a 2.5-month grace period. FSAs are available with
any plan type, including PPOs, but the limit is lower and unused balance is forfeited.
HSA. 2026 limit is $4,400 single and $8,750 family. Contributions are
pre-tax through payroll. Unused balance rolls over indefinitely, can be invested, and
belongs to the account holder across job changes. HSAs are only available alongside an
HDHP that meets the IRS minimum deductible.
The decision rule, in plain terms: choose an FSA when an HDHP is not available or not the
right fit and there is a known annual healthcare spend that fits within the $3,300 limit.
Choose an HSA when the HDHP plan otherwise makes sense, since the HSA's flexibility and
multi-year compounding meaningfully outweigh the FSA's slightly broader plan compatibility.
The Self-Employed Alternative: ACA Marketplace
The pre-tax payroll structure stops at the boundary between employer-sponsored and
individual coverage. A 1099 contractor or sole proprietor buying an ACA marketplace plan
pays the premium with after-tax dollars in the strict cash sense, then claims the
self-employed health insurance deduction on Schedule 1 of the federal return — which gives
back federal income tax but not FICA. The mechanics are different from a Section 125
deduction, and the all-in numbers usually look meaningfully higher.
Concrete shape: a 1099 worker at $80,000 of net self-employment income, single, no
dependents, looking at a benchmark silver marketplace plan. Recent KFF and HealthCare.gov
data place the unsubsidised national-benchmark silver premium near $580 per month for a
40-year-old single enrollee EstimatedKFF 2025 EHBS. Projected forward modestly to 2026, treat that as roughly
$7,000 per year in premium EstimatedKFF 2025 EHBS. Premium Tax Credits phase out near 400% of the federal poverty
level — about $58,320 for a single filer in the 2025 reference year — so an $80,000 net
income generally lands above the subsidy cliff and pays the full premium.
Side-by-side rough comparison: an employer-sponsored PPO at $4,800 in employee premium
effectively costs about $3,377 in after-tax take-home thanks to the Section 125 shelter,
while a $7,000 marketplace premium offset by a self-employed-health-insurance deduction at
a 22% federal rate effectively costs about $5,460 in after-tax take-home. The structural
gap is roughly $2,000 per year for equivalent coverage, on top of any employer subsidy on
the premium itself. That is the price of leaving the employer payroll structure, before
any judgement about flexibility, network, or self-employment trade-offs.
Compounding Effects: HSA Contributions Reduce State Tax Too
Most states conform to the federal HSA treatment, meaning HSA contributions reduce both
federal and state taxable income. There are exceptions worth knowing about. California and
New Jersey do not conform: HSA contributions are not deductible at the state level, and
HSA earnings can be taxable as state-level investment income. A California resident still
receives the full federal tax advantage from an HSA, but the state-tax piece of the math
drops out, which narrows the effective benefit relative to what a Texas or Florida HSA
holder receives on the same contribution.
Numerical shape, single filer, $80,000 wages, $4,400 HSA contribution: a state-conforming
jurisdiction at a 5% state marginal rate produces about $4,400 × (0.22 + 0.05 + 0.0765) =
$1,525 of total tax savings. The same household in California at roughly the same
marginal stack but without state HSA deduction loses the $4,400 × 0.05 = $220 piece, for
a total of about $1,305. Modest in isolation, but the gap compounds across years and is
one reason HSA strategy looks slightly different by state.
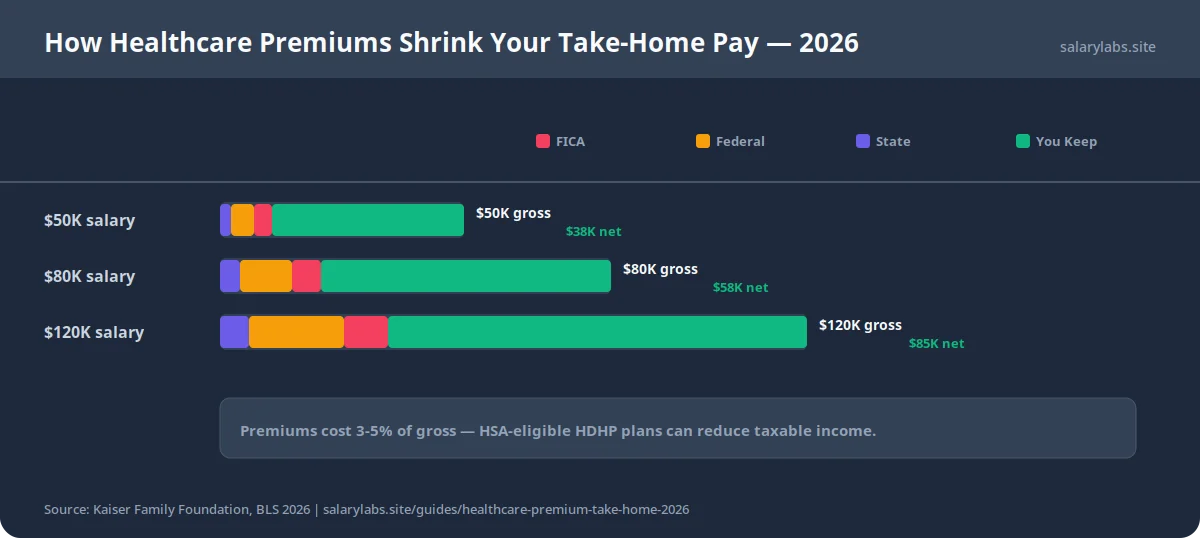
How Healthcare Premiums Shrink Your Take-Home Pay — 2026 — salarylabs.site
How Healthcare Premiums Shrink Your Take-Home Pay — 2026Stacked bars show gross salary minus employee-paid premium at three income levels. At $50K: ~$2,400 annual premium, net $47,600. At $80K: ~$4,200 annual premium, net $75,800. At $120K: ~$6,000 annual premium, net $114,000. Premiums reduce gross before income tax, FICA, and (in most states) state income tax.
Realistic Take-Home Impact Table
We bring the moving parts together for a single filer at $80,000 nominal wages. We assume
no other pre-tax deductions and a state with no income tax to keep the comparison clean.
Numbers are rounded illustrative figures, not personal projections.
Scenario
Premium structure
HSA effect
Approx real take-home
Employer HDHP + max HSA
~$2,400 pre-tax premium
+$1,525 tax saved on $4,400
~$58,000
Employer PPO single
~$4,800 pre-tax premium
None
~$56,500
Self-employed ACA silver, no subsidy
~$7,000 post-tax with SEHI deduction
HSA only if HDHP marketplace plan
~$51,500
1099 worker, no insurance
$0 premium, full liability exposure
None
~$59,000 nominal, not recommended
Reading: the employer-sponsored HDHP+HSA scenario lands roughly $1,500 ahead of the PPO
single scenario at this income level, before the HDHP holder uses the deductible. The
self-employed silver-plan scenario lands roughly $6,500 below employer-sponsored,
consistent with the structural premium and tax-shelter differences described above. The
uninsured 1099 scenario looks better on paper for a single year and is excluded from
sensible planning because a single hospitalisation can erase several years of the
apparent saving.
Estimate your annual healthcare usage
Low users benefit from HDHP + HSA. High users often save more with lower-deductible PPO or HMO.
Calculate the true premium cost
Pre-tax premiums reduce taxable income. A $300/mo premium costs less than $300 after the tax benefit.
Check HSA eligibility
HDHP plan qualifies for HSA contributions. $4,400 individual / $8,750 family limit in 2026.
Compare out-of-pocket maximums
The worst-case scenario matters as much as the premium. What is the max you could pay in a bad year?
Run the numbers on take-home impact
Use the Take Home Pay Calculator to see exactly how each plan election changes your net paycheck.
Decision Framework
The math suggests a clean default order, with exceptions:
HDHP + HSA, fully funded. Best fit for healthy single workers, savers
with cash to fund the HSA, and households that can absorb the deductible without going
into debt during a high-utilisation year.
PPO single or PPO family. Best fit for chronic conditions, frequent
specialist visits, families with young children, or anyone with predictable high
utilisation where the lower deductible compounds against the higher premium.
HMO single. Reasonable when the network covers the household's care
and a lower premium matters more than choice. Verify in-network coverage of relevant
specialists before committing.
ACA marketplace. The right answer for self-employed workers, gig
contractors between W-2 jobs, early retirees pre-Medicare, and anyone whose employer
does not offer coverage. Run the subsidy calculator on HealthCare.gov before treating
the unsubsidised premium as the actual cost.
Limitations
Employer subsidy variation. The premium ranges in this guide reflect the
employee-paid portion. Employer subsidy varies enormously, from 50% to 95% of total
premium. Two workers at the same salary at different employers may face very different
net costs for nominally similar plans.
Out-of-pocket maximums. ACA-compliant plans cap annual out-of-pocket
exposure, which limits the worst-case downside of a high-deductible plan during a
catastrophic year. The cap moves with inflation each year and varies by plan. Reading
the Summary of Benefits and Coverage for the specific plan is the only reliable check.
Geographic premium variation. Marketplace and employer-sponsored
premiums both vary by state, county, and rating area. The 2024-2025 KFF benchmark
figures used here are national averages projected forward. Specific quotes for a
specific ZIP can land 25% above or below the average.
Plan-year design changes. Deductibles, copay structures, and provider
networks can change at each annual enrollment, even when the plan name does not. Past
years' net cost is not a reliable predictor of next year's net cost without re-running
the math.
State Medicaid expansion gap. Workers earning below the marketplace
subsidy floor in non-expansion states can fall into a coverage gap with no affordable
option. This guide does not cover that case in detail; the federal poverty level
thresholds in expansion vs non-expansion states differ.
The Healthcare Premium Rule
Pre-tax premiums cost less than they look — but the right plan still depends on your usage.
A $400/month pre-tax premium on a $75K salary costs roughly $280/month after federal tax and FICA savings. But a low-premium HDHP with a $3,000 deductible can cost more in a bad health year than a higher-premium PPO. Run both scenarios before open enrollment.
Published 2026-05-21. The KFF Employer Health Benefits Survey publishes annually in early
autumn; this guide will be revised when the 2026 reference figures are released. Updates
logged in Methodology.