
Evaluating a Job Offer on Total Compensation

Most job seekers compare offers by base salary alone. That is the wrong comparison. Two offers with identical base salaries can differ by $30,000 or more in first-year economic value — depending on signing bonus, equity, employer health contributions, and retirement match. This guide provides the framework to evaluate all of it before deciding whether to accept, negotiate, or decline.
The salary negotiation guide covers how to conduct the conversation with a prospective employer. This guide focuses on the calculation before the conversation: what is Offer A actually worth compared to Offer B, expressed in comparable terms?
The compensation stack
A job offer has layers. Some layers are certain cash. Some are expected cash. Some are conditional. Some are benefits with dollar values you may not see on a pay stub. The first step is decomposing every offer into its components:
- Base salary — guaranteed cash, paid regardless of performance.
- Signing bonus — guaranteed cash, paid once at or near start date.
- Annual bonus — variable cash, depends on individual and company performance.
- Equity — RSUs, stock options, or other ownership instruments. Highly variable in value.
- Employer health contribution — the dollar value of the employer's share of your health premium. Often the largest hidden benefit.
- 401(k) employer match — guaranteed return on your contribution. Near-instant value.
- Paid time off — salary value of vacation, sick, and holidays.
- Other benefits — HSA contributions, professional development budget, home office stipend, commuter benefits, life insurance, disability coverage.
The mental model: compare guaranteed cash first, then expected cash, then conditional and benefit value. Keep each component separate so you can see which offer actually wins on each dimension.
Guaranteed compensation: the foundation
Guaranteed compensation is the value that does not depend on company performance, stock price, or personal achievement targets. It should be the first comparison.
Base salary
Base salary is the anchor. It sets your take-home pay, your 401(k) contribution base, your disability and life insurance coverage limits, and your future raise and bonus baselines. A $10,000 base difference, compounded over five years of 3% annual raises, is worth approximately $57,000 in cumulative gross earnings — before taxes.
Convert base to effective hourly rate using your expected work hours. A $125,000 salary at 40 hours per week, 50 weeks per year equals $62.50 per hour. At 50 hours per week, it drops to $50.00. That difference matters for evaluating overtime-loaded roles.
Employer-paid health insurance
This is the most commonly overlooked component of a job offer. Employers typically cover 70–85% of health plan premiums. According to the Kaiser Family Foundation 2025 Employer Health Benefits Survey KFF 2025 EHBS verified 2026-07-31 , the total annual premium for single coverage averages $9,325 Verified , of which employees pay approximately $1,440 (16%). The employer pays the remaining $7,885 per year Verified . For family coverage, the total averages $26,993 annually, with employee contributions of $6,850 and employer contributions of $20,143 per year Verified .
These figures represent employer cash contributions to your health coverage that you would otherwise pay out of pocket — on the open market, through COBRA, or through a spouse's plan. When comparing two offers where one includes employer health coverage and one requires you to self-insure, the employer's contribution is part of your total compensation.
The value depends on your situation: whether you need single or family coverage, whether a spouse's plan is available, and what the plan designs look like. A $7,885 employer contribution toward a high-deductible health plan costs you the HSA-eligible plan deductible and out-of-pocket maximum in a worst case. The employer contribution is real value, but the benefit is not equivalent to cash in your account.
401(k) employer match
The employer match is the most immediately quantifiable benefit. According to Vanguard's How America Saves 2025 Vanguard How America Saves 2025 (2024 plan-year data (released 2025)) verified 2026-07-31 , the average employer match is approximately 4.6% of salary, and the median is 4.0% Verified . Most employers match $0.50 on the dollar up to the first 6% of salary — meaning a 3% employee contribution gets a full 3% employer match, and a 6% contribution gets a 3% employer match.
At a $125,000 salary: a 4% employer match is worth $5,000 per year. It is guaranteed the moment you are eligible and contribute enough to capture it. Unlike equity or bonus, there is no performance condition — you receive it by contributing your own deferral.
The retirement guide covers contribution strategy and the stack of HSA, IRA, and 401(k) in more detail. For offer evaluation, the key number is the match percentage and the salary cap on match eligibility.
Paid time off
PTO has a cash value. At a $125,000 salary and 2,080 work hours per year, each vacation day is worth approximately $480 in gross pay. Ten extra vacation days at a $125,000 salary equals $4,800 in equivalent cash value. Fifteen vacation days versus 25 vacation days represents approximately $12,000 in gross salary differential at that salary level.
Holidays (federal holidays, typically 10–11 per year) and sick days (employer-provided sick leave, which varies) add to the total PTO value. The calculation depends on how your employer structures PTO: some use separate vacation/sick/holiday banks, others use a combined bank.
Variable compensation and conditional benefits
Variable compensation requires a probability-weighted estimate. A 10% target bonus at a $125,000 salary has an expected value of $12,500 — but the actual payout may be $0 or $25,000, depending on company and individual performance. Always ask for the historical bonus payout rate at the company for employees at your level.
Annual bonus
Bonuses vary by company, role, and year. Technology and finance roles typically have higher target bonus percentages (10–30% for senior individual contributors; 15–50% for directors and above) than administrative or operational roles (3–8%). Target bonus is not guaranteed payout.
When comparing offers, weight the target bonus by your estimate of actual payout probability. A conservative estimate is 50–70% of target for a stable company with a strong bonus history. For early-stage startups or companies with volatile financial performance, a conservative estimate is 0–30% of target. Treat equity in early-stage companies accordingly.
Equity: RSUs, stock options, and vesting
Equity is the most complex component to evaluate and the most commonly mishandled in offer comparisons.
RSUs (Restricted Stock Units) are the most common equity instrument in public and late-stage private companies. RSUs vest over a schedule (typically four years with a one-year cliff) and pay out at vesting at the company's stock price. The value is predictable at vesting for public companies. For private companies, the value may be illiquid for years or may never vest if an exit does not occur.
Stock options give you the right to purchase stock at a set strike price. Options have value only if the stock price rises above the strike price. Options expire shortly after leaving a company (typically 90 days). Options in early-stage private companies have speculative value — assign a probability of a liquidity event and a probability-weighted expected value rather than face value.
Vesting schedules typically follow a four-year schedule with a one-year cliff. At cliff vesting, 25% of your equity grants vest at the end of your first year. After the cliff, the remaining 75% vests monthly or quarterly over the next 36 months. A one-year cliff means you receive nothing if you leave before 12 months.
Annualized equity value is the year-1 grant value divided by four. At a $150,000 RSU grant over four years at a public company with a stable stock price, the annualized value is $37,500 per year. That figure should be discounted if the stock is volatile, illiquid, or in a company with a short public history.
The BLS National Compensation Survey does not separately track RSU prevalence in its published benefit tables. Research using General Social Survey data (pooled 2014–2022) suggests approximately 39% of technology sector employees have access to stock options, compared to approximately 9% across all private industry workers Historical . The technology sector figure is likely higher for RSUs specifically since RSUs became the dominant equity instrument after 2015.
Signing bonus
Signing bonuses are one-time cash payments at or near your start date. According to compensation research from multiple firms including CompBldr and JRG Partners (2026), signing bonuses typically range from 5–15% of base salary for mid-level professional roles, and 10–25% for senior or specialized roles Estimated . Technology and finance roles with equity components often see higher signing bonuses to offset back-loaded equity vesting schedules.
Many signing bonuses include a clawback provision: if you leave within the first 12 months, you repay some or all of the bonus. Ask whether the bonus has a clawback and what the repayment schedule looks like before comparing two offers where one includes a large signing bonus.
Worked example: Offer A vs Offer B
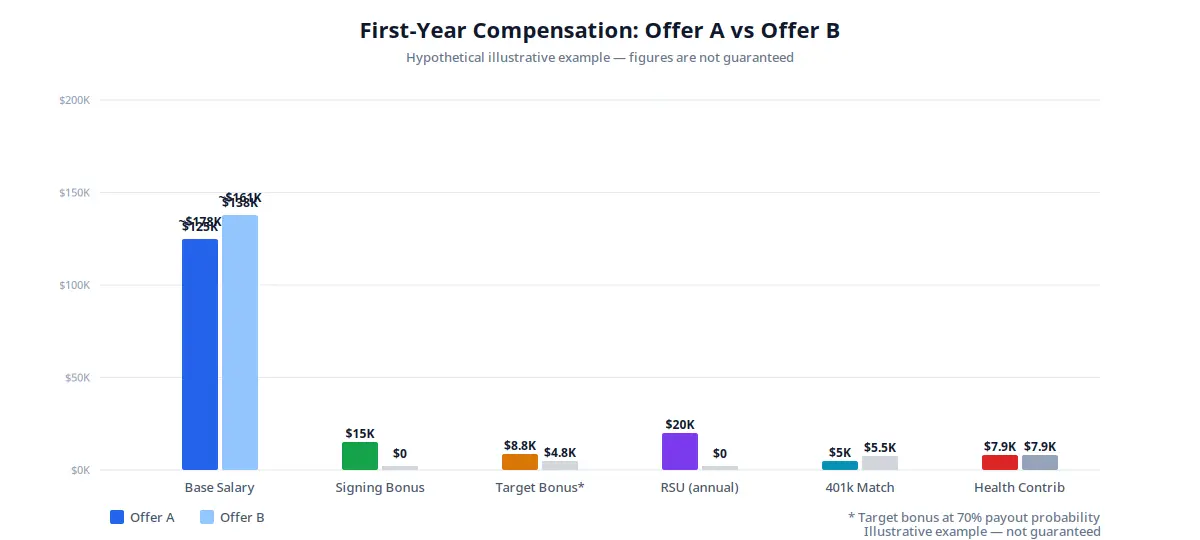
Consider two offers at a mid-level professional role in a stable industry. Both have a base salary around $125,000–$138,000. This comparison shows how the full stack changes the picture.
View data table
| Component | Offer A | Offer B | Notes |
|---|---|---|---|
| Base salary | $125,000 | $138,000 | Offer B leads by $13,000 |
| Signing bonus | $15,000 | $0 | One-time. Offer A leads Year 1 by $15,000 |
| Target bonus (10%) | $12,500 | $6,900 | At 70% payout probability: Offer A $8,750 vs Offer B $4,830 expected value |
| RSU grant (annualized) | $20,000 | $0 | 4-year vest, cliff + monthly. Offer A has equity; Offer B does not |
| 401(k) match (4%) | $5,000 | $5,520 | Offer B leads by $520 |
| Employer health (single) | $7,885 | $7,885 | Equal. KFF 2025 single coverage average employer contribution |
| PTO (20 days vs 15 days) | $0 (already in base) | $0 (already in base) | Value is implicit in base salary comparison. PTO difference is real quality-of-life value |
| Year 1 expected value | ~$178,500 | ~$158,310 | Offer A leads by ~$20,190 in Year 1 |
| Recurring annual value (equity vested) | ~$163,500 | ~$155,310 | Offer A leads by ~$8,190 recurring after Year 1 vesting cliff |
In this example, Offer A wins in Year 1 by approximately $20,000 due to the signing bonus and equity grant. Offer B closes the gap in recurring value, leading by $520 in 401(k) match and by $13,000 in base — but Offer A maintains an $8,190 annual advantage once equity vests.
The deciding factors depend on your priorities: if you need Year 1 cash (to pay off debt, make a large purchase, or build an emergency fund), Offer A's signing bonus is real value. If you are optimizing for long-term compounding and have an emergency fund, the equity vest in Offer A adds recurring value that compounds in retirement accounts.
Neither offer is objectively better. The framework reveals the dimensions of difference so you can make an informed decision based on your financial situation, risk tolerance, and timeline.
Year 1 value vs recurring value
One of the most important distinctions in offer evaluation is Year 1 value versus recurring annual value. The signing bonus, any sign-on RSU grant, and the first equity cliff vesting are all Year 1 events. After Year 1, recurring compensation is what matters for multi-year planning.
A job offer that wins on Year 1 may lose on recurring value, and vice versa. A 2026 ADP Compensation Budget Survey indicates that the median budget for annual merit increases in stable companies is 3–4%. The gap between two base salaries compounds at roughly 3–4% per year. A $13,000 base gap at 4% annual merit growth becomes a $14,690 gap in Year 5. The recurring value comparison matters for your five-year financial plan.
For roles where equity is a major component, the four-year vesting schedule means your total compensation is front-loaded in years 1–2 and back-loaded in years 3–4 if you stay. Calculate whether the equity grant and vest schedule justify staying through each cliff and through the full four years, versus a role with higher base and no equity.
The salary time machine tool can project how different salary growth paths compound over time. Use it to model Offer A versus Offer B as parallel career scenarios.
Questions to ask before accepting
Before accepting any offer, clarify the following with the recruiter or hiring manager. Written answers carry more weight than verbal assurances.
- What is the full equity grant? Number of shares, strike price (for options), current 409A valuation (for private companies), vesting schedule, and cliff date.
- What is the target bonus payout history? Ask for the average and range of bonus payouts for employees at your level in the last two years.
- What health plan options are available? Single premium, family premium, HSA eligibility, and employer contribution amount. Get the actual premium amounts, not just the plan names.
- What is the 401(k) match formula? Dollar-for-dollar or tiered? Match cap as a percentage of salary or as a dollar amount? When does matching begin (immediately or after a waiting period)?
- What is the PTO policy? Separate vacation/sick/holiday banks or combined? How many days of combined PTO is standard for your level?
- Is the signing bonus subject to clawback? Repayment terms and timeline if you leave before 12 months.
- What are the health plan options and what does the employer contribute? Get the per-paycheck deduction amount, not just the plan names.
- Is there a relocation package, and what does it cover? If the role requires moving, a structured relocation package has real dollar value.
Sources and methodology
This guide's worked example uses illustrative figures. The Tier 1 and Tier 2 sources below provide the underlying benchmarks (health premium averages, 401(k) match rates, equity access). Industry sources are used for signing bonus ranges and merit-increase budgets, which do not have a single authoritative public dataset.
How this guide's worked example was constructed
A two-offer comparison showing how base salary, signing bonus, target bonus, equity, 401(k) match, and employer health contributions combine into first-year and recurring annual value.
Each component is treated independently. The 'expected' value of the target bonus uses a 70% payout probability (a common industry midpoint). The employer health contribution uses KFF 2025 single-coverage average. 401(k) match uses the 4% median employer match from Vanguard.
KFF 2025 EHBS, Vanguard How America Saves 2025, BLS NCS March 2025.
Offer A and Offer B are hypothetical mid-level professional offers in a stable industry. Equity values are annualized at grant; actual realized value depends on stock performance and vesting. The 70% bonus payout probability is an illustrative midpoint; ask the employer for actual payout history.
Equity value fluctuates with stock price. Signing bonus may be subject to clawback if you leave within 12 months. Health plan design (deductible, network, out-of-pocket maximum) affects the realized value of the employer's premium contribution. Bonus payouts vary by industry and year.
Sources cited
- Kaiser Family Foundation Employer Health Benefits Survey 2025 KFF 2025 EHBS verified 2026-07-31 — employer and worker health premium contributions, single and family coverage averages.
- Vanguard How America Saves 2025 Vanguard How America Saves 2025 (2024 plan-year data (released 2025)) verified 2026-07-31 — 401(k) match rates, contribution patterns, plan design features.
- BLS National Compensation Survey — Employee Benefits in the United States, March 2025 BLS NCS (March 2025) verified 2026-07-31 — stock option access by industry and sector.
- IRS Publication 15-T IRS Pub 15-T (2026) verified 2026-07-31 — federal income tax withholding tables and methods.
- SSA Contribution and Benefit Base SSA Wage Base (2026) verified 2026-07-31 — Social Security and Medicare contribution rates and wage base.
- CompBldr Sign-On Bonus Benchmarks 2026 CompBldr Sign-On 2026 verified 2026-07-31 — signing bonus ranges by level and function. Industry estimate.
- ADP Compensation Budget Survey 2026 ADP 2026 Comp Budget verified 2026-08-13 — median merit increase budgets by company type. Industry estimate.
All figures in this guide are illustrative unless cited to a specific source. Compensation varies by employer, industry, geography, and individual circumstance. This guide does not constitute financial, tax, or legal advice. Consult a financial advisor for personalized compensation planning.