

Living Wage by State 2026: What You Actually Need to Earn
The living wage is not the poverty line. It is not the minimum wage. It is the hourly rate a full-time worker needs to cover the actual cost of basic needs — housing, food, healthcare, childcare, transportation — in their community, without government assistance.See how your current wage compares to the living wage in your state using the Take Home Pay Calculator.
The MIT Living Wage Calculator, updated February 2026, provides county-level estimates for all 3,144 US counties. This guide synthesizes the state-level findings and explains what the numbers mean in practice.
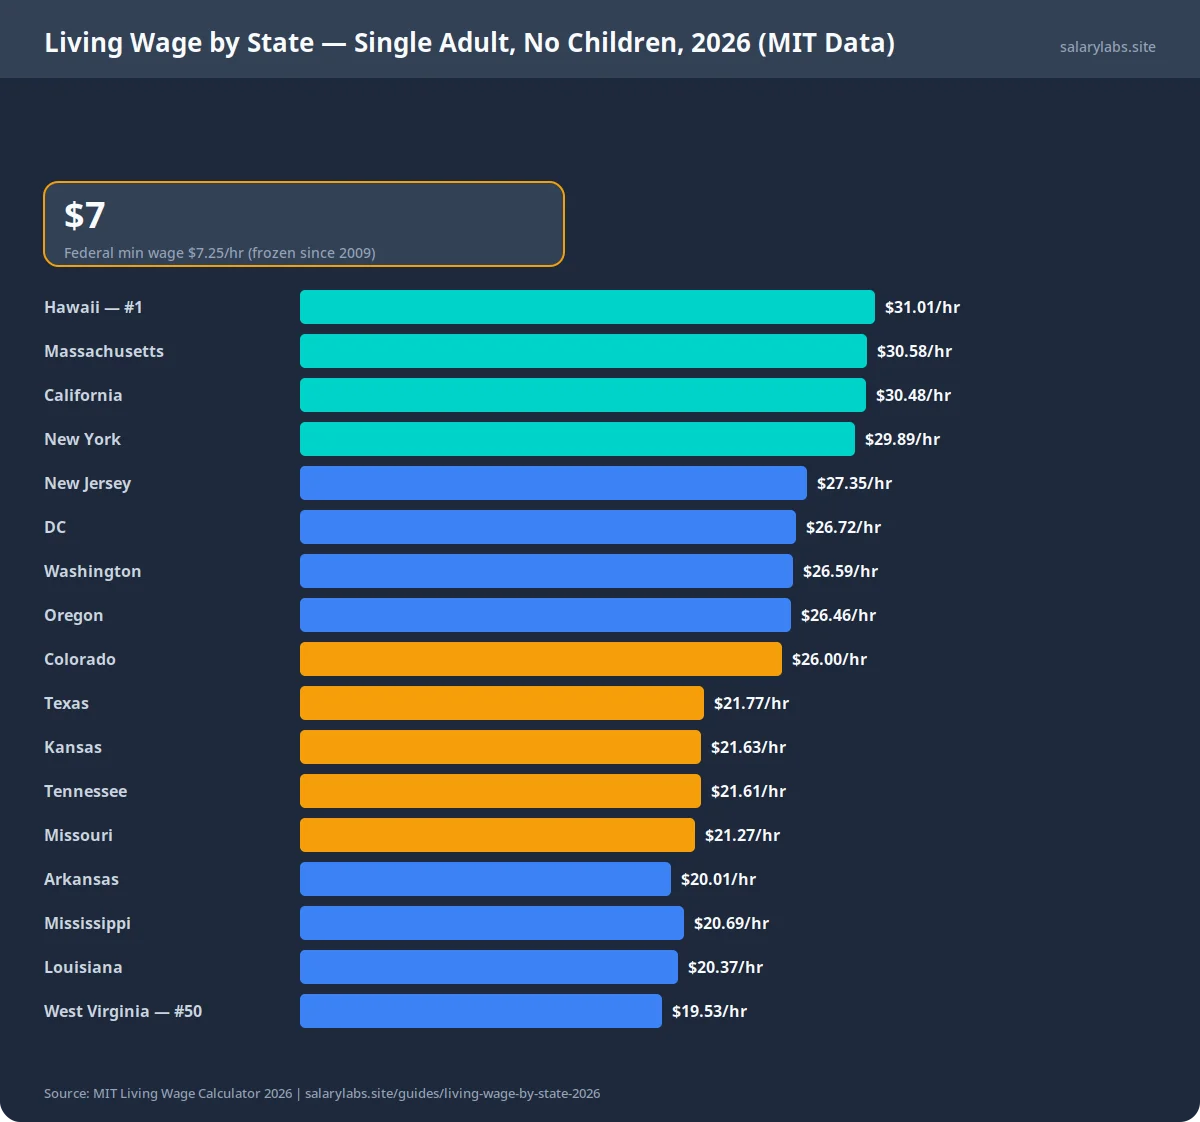
Living wage varies by county and household composition. Bars show approximate hourly rates relative to the highest state (Hawaii, $31.01/hr).
What Goes Into the Living Wage
Unlike the federal poverty threshold or minimum wage, the living wage reflects actual geographic cost differences. It includes eight categories:
Living Wage by State — Single Adult, No Children (2026)
The hourly wage a single adult needs for basic costs. Full-time = 2,080 hours/year.
Single adult, no children, working full-time (2,080 hours/year). State-level estimates aggregated from county-level MIT Living Wage (Annual (most recent release))verified 2026-07-31 data, February 2026. Annual equivalent = living wage × 2,080.
Family Size Changes Everything
A single adult with no children has the lowest living wage. Add children — particularly infants and toddlers — and the required hourly wage jumps $16–30/hour in every state.Calculate how much take-home pay you need for your household size in your state.
Hourly living wage for 1 adult working full-time. Adding two children typically increases the required wage by $16–30/hour depending on the state. Source: MIT Living Wage Calculator, February 2026.
The Minimum Wage Gap
The federal minimum wage has been $7.25/hour since 2009 — 17 years without an increase. Twenty-one states and Washington, D.C. have set their own minimums above the federal floor.But even the highest state minimum wages fall short of the living wage.
State minimum wages as of January 2026. Georgia and Wyoming have no state minimum wage — workers fall under the federal $7.25/hour floor. In every state shown, minimum wage falls below the single-adult living wage.
How to Use This Number
The living wage is not a aspirational target — it is a floor. If your current wage is below the living wage for your state, you are working more hours than full-time would require to cover basic needs.
For job seekers and employees
When evaluating an offer, compare the total compensation against your state's living wagefor your household composition. A $60,000 salary in Mississippi goes further than $80,000 in Hawaii — but the Mississippi living wage is still $20.69/hour, meaning $60K requiresworking 2,880 hours (38% above full-time) to cover costs.Run the numbers for your exact situation with the Take Home Pay Calculator.
For employers
Living wage data gives you a defensible benchmark for compensation decisions. Paying at or above the living wage reduces turnover, supports recruitment, and provides a credible narrative for pay equity reporting.
For policymakers
The gap between minimum wage and living wage — $13–17/hour in most states — quantifies the subsidy gap that taxpayers cover through SNAP, Medicaid, and EITC. Raising the minimum wage to the living wage would reduce public assistance costs while supporting workers.
Calculate your actual take-home pay in any state to see how close you are to the living wage. Pair this with the Minimum Wage by State guide to understand how your state compares, and Average Salary by State to see how your earnings benchmark against local medians.
Related Guides
- Minimum Wage by State 2026 — Every state's minimum wage and which are above federal.
- Cost of Living by State — What your salary buys in each state.
- Average Salary by State 2026 — Median earnings across all industries.
- Take Home Pay Calculator — See your actual paycheck after taxes.
View data table
| Rank | Job / Category | Value |
|---|---|---|
| 1 | Hawaii — #1 | 31.01 |
| 2 | Massachusetts | 30.58 |
| 3 | California | 30.48 |
| 4 | New York | 29.89 |
| 5 | New Jersey | 27.35 |
| 6 | DC | 26.72 |
| 7 | Washington | 26.59 |
| 8 | Oregon | 26.46 |
| 9 | Colorado | 26.0 |
| 10 | Texas | 21.77 |
| 11 | Kansas | 21.63 |
| 12 | Tennessee | 21.61 |
| 13 | Missouri | 21.27 |
| 14 | Arkansas | 20.01 |
| 15 | Mississippi | 20.69 |
| 16 | Louisiana | 20.37 |
| 17 | West Virginia — #50 | 19.53 |