

Highest Paying Jobs in America 2026: BLS Data and Career Paths
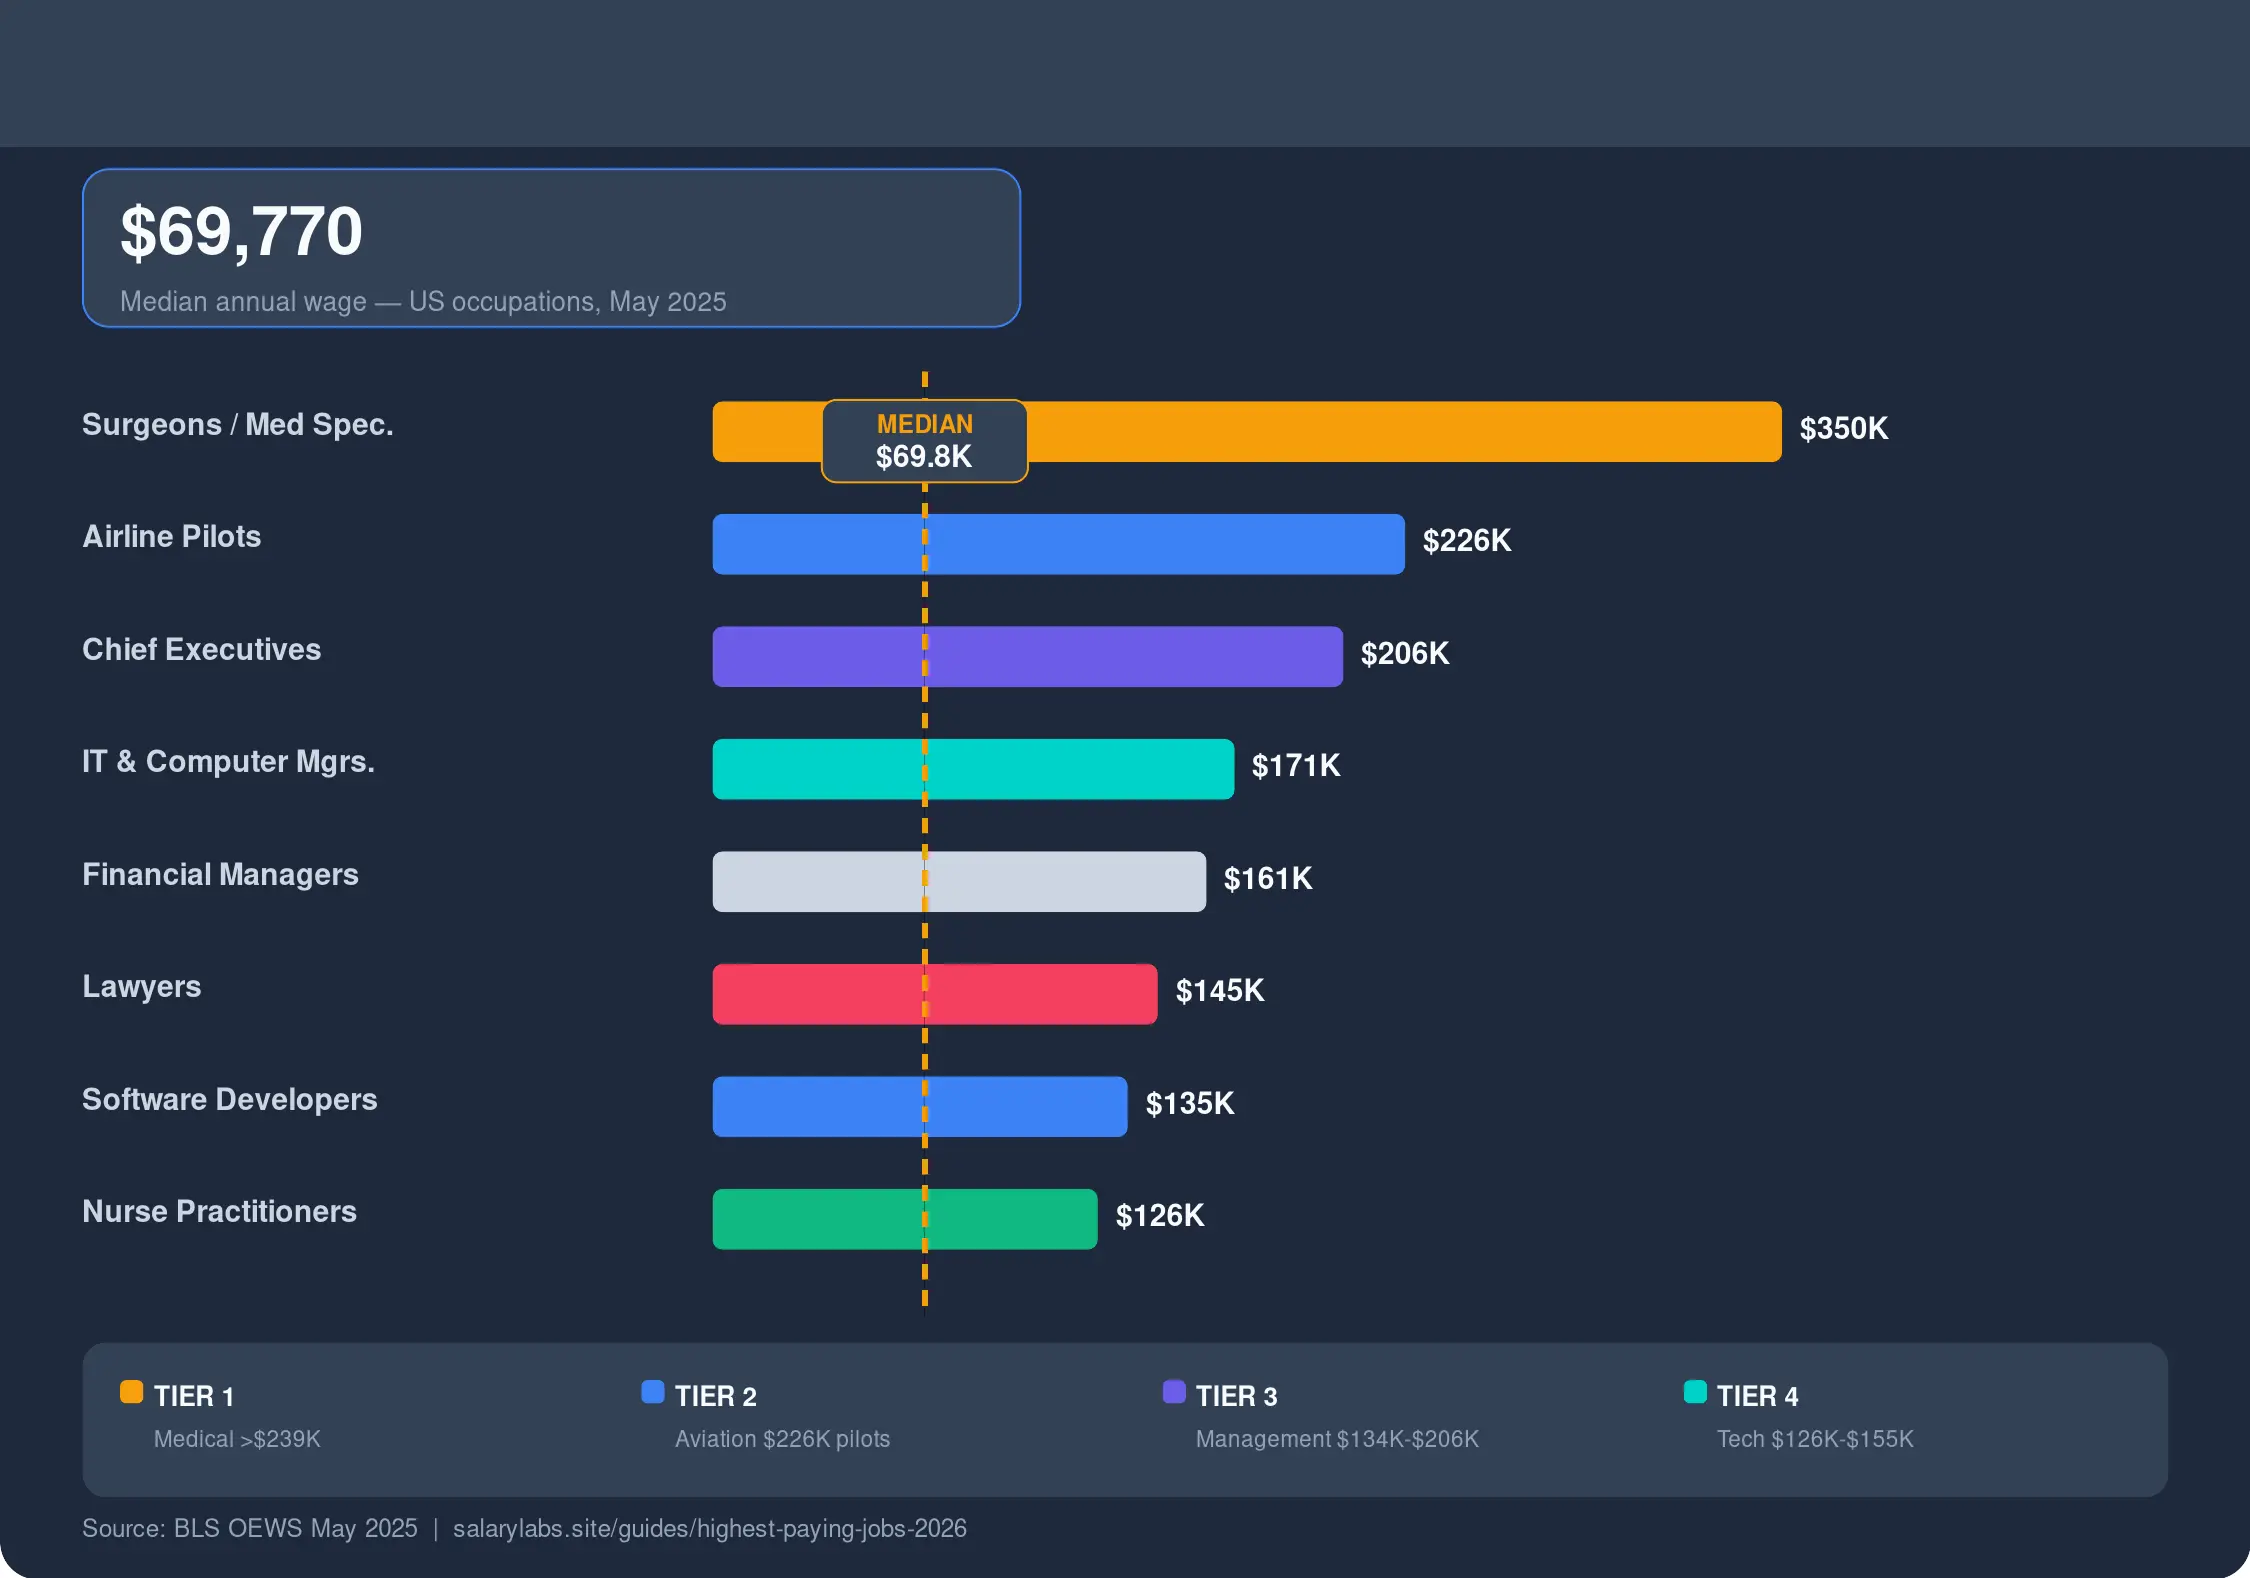
Healthcare dominates the top of America's pay scale — and it is not close. Every occupation with a median annual wage above $239,200 is a medical specialty. Pilots, executives, and tech managers lead everything else.
Here is what the data actually shows. The full BLS Occupational Employment and Wage Statistics (OEWS) picture, broken down by tier. This guide uses BLS OEWS May 2025 data — the most recent published dataset — as the anchor for all national median figures and employment counts.
BLS caps reported wages at $239,200. Actual median pay for most of these specialties exceeds $300,000 in private practice or hospital employment. Data: BLS OEWS (May 2024 (most recent available as of 2026-07; May 2025 release tracked separately))verified 2026-07-31, May 2025.
Pilot wages reflect experience, aircraft type, and airline. Entry-level first officers at regional carriers earn substantially less than the major-airline median. Data: BLS OEWS (May 2024 (most recent available as of 2026-07; May 2025 release tracked separately))verified 2026-07-31, May 2025.
CEO wages exclude stock awards, options, and deferred compensation — the majority of executive pay. BLS median understates typical CEO total compensation at large companies. Data: BLS OEWS, May 2025.
Tech wages vary sharply by geography. San Francisco, Seattle, and New York pay 30–60% above the national median for the same roles. Remote work has begun compressing some of that gap. Data: BLS OEWS, May 2025.
What the Top 10% Actually Earns
The BLS median is where half of workers earn more and half earn less. For the top 10%, the numbers are very different:
The gap between the median and the 90th percentile shows how compressed most occupations are — versus how much the top tail stretches in medicine, law, finance, and tech.
Three Realistic Paths to Six Figures
Path 1: Technology Verified
Computer science or software engineering is the most common high-earning path that does not require a professional degree. The median for software developers ($135,980) is nearly double the national median — and entry-level salaries at top tech companies regularly exceed $150,000.
Realistic timeline: 2–4 years for a CS degree or coding bootcamp to first job. 5–10 years to senior or staff level at the median shown above.
Path 2: Healthcare (Non-Physician) Verified
Nurse anesthetists ($223,200+) and nurse practitioners ($126,000+) are the highest-paying roles accessible without a medical or law degree. Both require advanced practice registered nurse (APRN) credentials.
Realistic timeline: 4 years (BSN) + 2–3 years (MSN/DNP) for an APRN role. Total: 6–7 years post-high school.
Path 3: Management Industry estimate
Most managers earn less than $100,000. But at the senior level — IT management, finance, operations — $150,000–$200,000+ is achievable without a professional degree. The path is longer but accessible through demonstrated performance.
Realistic timeline: 5–15 years of career progression from individual contributor to senior management. An MBA accelerates the path but is not strictly required.
See Where You Stand
These tools let you benchmark your current compensation against the national picture:
- Income Percentile Calculator — See where your income falls nationally, including how you compare to the BLS median for your occupation.
- Salary Comparison Tool — Compare pay across specific roles, industries, and geographies side by side.
- Software Engineer Salaries — Full breakdown of tech pay by level, city, and company tier.
- Registered Nurse Salaries — RN and APRN pay across states and specialties.
- Salary Negotiation Framework — How to use this pay data to ask for more in your next conversation.
Understanding where you sit relative to the BLS median and top-quartile earners gives you a concrete anchor for any negotiation. Run the numbers, then make the case.