Salary Guide
US vs Europe salary comparison in a 2026 planning view. See how American and European pay stacks up across gross salary, take-home, and bundled benefits.
Sources cited 2026 data Updated June 2026 'IRS · BLS · SSA'

US vs Europe Salary: Gross Pay Is Only the First Layer

The usual headline is that US workers earn more. That is directionally true in many private-sector roles, but it is still an incomplete answer. Gross salary, tax burden, healthcare, leave, and job security all move the comparison.

This page is best read as a decision guide, not a winner-loser scoreboard. The real question is what somewhat compensation system fits your role, family, and risk tolerance.

Want to see where your salary stands globally? Use our Global Salary Comparison tool for a quick, personalized benchmark.
US leads
Private-sector gross salary — directional US premium context
Source: BLS, Eurostat, OECD 2026
Compare your salary against global peers. Use the income percentile calculator to see where US pay stands relative to US distribution, or compare two specific job offers with the salary comparison tool.

How to Use This Comparison

Higher gross US typically leads on pre-tax salary in private sector
30+ days Typical statutory vacation in Western Europe vs ~10 US
COL-adj Purchasing power varies widely — gross alone misleads

This page works best when you read it in layers rather than as a simple “US good / Europe bad” chart:

  • Read gross pay first: it tells you where the headline market premium sits.
  • Read take-home second: this shows how much of that premium survives tax and payroll structure.
  • Read benefits last: leave, healthcare, and job protection are where the tradeoff becomes more personal than mathematical.
Interactive Evidence
Gross, net, and benefits tradeoff
Switch the lens to see why the same cross-market decision can look different when you compare headline pay, take-home pay, or bundled labor protections.
United States $8.3K / month Higher gross pay is common in private-sector tech.
Europe $5.6K to $5.9K Lower gross pay is often paired with stronger public benefits.
Tradeoff Cash first The US usually wins the salary headline.
Gross pay comparisons usually favor the US, especially in tech and finance. The tradeoff becomes more nuanced once benefits and out-of-pocket costs enter the picture.

Gross Salary: US vs Major European Countries (2026)

The table below shows directional monthly gross pay in USD equivalents for mid-level roles. These are comparison anchors, not live offers, and cross-country methodology will always be rougher than a single-country wage guide.

Role 🇺🇸 USA 🇬🇧 UK 🇩🇪 Germany 🇳🇱 Netherlands 🇨🇭 Switzerland
Software Engineer $8,300 $5,800 $5,600 $5,900 $7,800
Data Scientist $8,100 $5,500 $5,300 $5,600 $7,400
Product Manager $9,500 $6,300 $5,900 $6,100 $8,200
UX/UI Designer $6,200 $4,600 $4,200 $4,500 $6,000
Marketing Manager $6,400 $4,500 $4,100 $4,300 $5,800
Finance / Accountant $6,200 $4,600 $4,300 $4,500 $6,200
Nurse / Healthcare $6,200 $4,300 $4,100 $4,600 $6,800
Teacher / Educator $4,500 $3,500 $3,700 $3,600 $5,200

* Monthly gross figures are USD-normalized comparison anchors for mid-level roles. They combine public wage references from each market into a 2025–2026 planning view, not live cross-border offer quotes.

Why US Salaries Are Higher

The US compensation premium is driven by several structural factors:

  • Employer-funded benefits cost: US employers often pay directly for health insurance, which can add substantial cost on top of salary. This helps explain part of the gross-pay gap versus countries with more publicly funded healthcare.
  • Equity and bonuses: US tech companies more commonly use RSUs and bonus-heavy packages. That structure is less common in many European markets.
  • Higher cost of living: Major US cities such as San Francisco, New York, and Seattle carry very high living costs, which pushes nominal wages upward.
  • At-will employment: Lower job protection in the US can be paired with higher pay in some private-sector markets, though the tradeoff varies by field and employer.

The Tax Difference: What You Actually Take Home

Gross salary comparisons can mislead because Europe pushes more cost through taxes while the US leaves more cost on the individual side. This table is a rough illustration of that difference, not a filing-grade tax model:

Country Gross/Month Est. Tax Rate Take-Home
🇺🇸 USA (no state tax) $8,000 ~24% ~$6,080
🇺🇸 USA (CA/NY state tax) $8,000 ~31% ~$5,520
🇬🇧 UK $8,000 ~35% ~$5,200
🇩🇪 Germany $8,000 ~42% ~$4,640
🇳🇱 Netherlands $8,000 ~40% ~$4,800
🇨🇭 Switzerland $8,000 ~25% ~$6,000

* Approximate effective rates for a single filer with simplified deductions. This is a rough planning comparison and does not model each country’s full social-contribution, pension, or city-level housing structure.

This table is intentionally rough. It helps explain why the gross-pay gap often shrinks after taxes, but it does not replace country-specific payroll modeling, pension rules, or city-level housing comparisons.

Benefits: Where Europe Has the Edge

Gross pay and take-home pay still miss part of the comparison. European labor systems often bundle more value into healthcare, leave, and job protection than the salary line alone suggests:

Healthcare
Universal coverage in most of Europe. US workers pay $200–$500+/month for employer-sponsored plans, plus deductibles.
tropical
Paid Vacation
EU mandates 20+ days/year. Many European companies give 25–30. US has no federal mandate — average is 10–15 days.
parental
Parental Leave
Germany: 14 months at ~67% pay. UK: up to 52 weeks. US: no federal paid leave mandate; most get 0–12 weeks unpaid.
Education
University tuition is free or heavily subsidized in Germany, France, and Scandinavia. US student debt averages $37,000+.

Who Wins? It Depends on Your Priorities

There is no clean universal winner. The better framework is to ask what somewhat tradeoff you are buying:

United States
Higher gross pay, more individual risk
  • Private-sector salaries often 30–50% above EU
  • Stock and equity upside in tech roles
  • ~10 days statutory vacation vs 30+ in EU
  • Healthcare costs sit with the individual
  • At-will employment — less job protection
Europe
Lower gross, stronger floor and benefits
  • Universal or employer-funded healthcare
  • 25–30 days statutory leave minimum
  • Stronger job protection and severance
  • Free/subsidized university in many countries
  • Higher taxes reduce the gross-pay advantage
The honest read: US wins on gross pay. Europe wins on bundled floor. The right answer depends on your role, healthcare needs, and how much you value income predictability over upside.
  • The US tends to fit better if: you are optimizing for upside, stock-heavy packages, or faster wealth-building in private-sector markets that reward risk and scarcity aggressively.
  • Europe tends to fit better if: you value bundled healthcare, stronger leave, lower downside risk, or you work in fields where the public/private pay gap is narrower.
How Does Your Salary Compare?
Enter your monthly salary to see how it ranks globally
$
Full global comparison with all roles →
The Real Comparison
Gross pay is the first layer. Benefits, taxes, and risk are the rest.
A $130,000 US salary and a €70,000 German salary look very different on paper. After taxes, healthcare costs, and leave value, the gap narrows considerably — and in some life situations, the German package is worth more in total. The right comparison is always system-level, not headline number.
US edge
Gross pay & upside
EU edge
Healthcare & leave
Tax gap
Smaller than it looks
Best move
Price the full system

US vs Europe Pay Questions

Do US workers get paid more than European workers?
In many private-sector roles, US gross pay runs higher than comparable European pay. The comparison gets more complicated once healthcare, leave, job protections, and tax-funded services are included.
Which European country pays the highest salaries?
Switzerland is usually the outlier at the top of European pay tables. After that, the answer depends heavily on industry, local taxes, and whether you care more about gross pay or purchasing power.
Is take-home pay in Europe really lower than the US?
Often yes at the top end, but the gap is smaller in the middle than gross salary tables suggest. Many European systems move more cost into taxes and away from out-of-pocket spending.
How do software engineer salaries compare between US and Europe?
US software-engineer pay is often higher in gross terms, and the gap widens further when stock-heavy compensation enters the picture. Europe tends to narrow the tradeoff with stronger leave and healthcare systems.
Cross-market next step

Cross-country pay comparisons work best as a decision frame, not a winner-loser scoreboard. Use the tools below to compare your own monthly pay, take-home result, and US purchasing power.
Free Tool
Use this next to benchmark your own monthly pay
Enter your monthly salary and role to compare it against directional market anchors across several countries. Use the output as context, not as a relocation verdict by itself.
Use the internal benchmark path before you chase a market headline
If this guide changes how you read your package, run the next checks inside SalaryLabs first: compare your take-home result, then see how far the same salary stretches across US states.
Was this guide helpful?
Thanks for your feedback!
See how far your salary goes in the US
Compare Purchasing Power by State → Find out what income percentile you're in
Salary Comparison Take Home Pay Income Percentile US Salary Heatmap Tax Brackets 2026 Software Engineer Salary Gross vs Net Pay Burnout Calculator
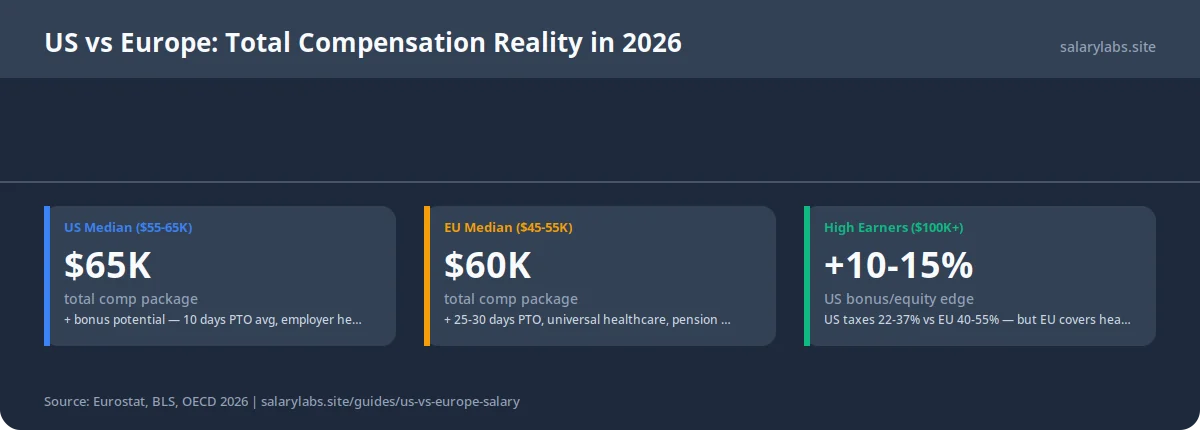
Three comparison cards showing US vs European total compensation. US median: $60K salary + 5 days PTO + limited benefits = ~$65K total comp. European median: $55K salary + 25-30 days PTO + universal healthcare + pension = ~$60K total comp. At $100K+: US 10-15% bonus + equity + fewer protections. At $150K+: EU taxes 40-55% vs US 22-37%, but EU healthcare + pension value offsets 15-20% of tax difference.
US vs Europe: Total Compensation Reality in 2026 — salarylabs.site
View data table
US vs Europe: Total Compensation Reality in 2026
Badge Value Label
US Median ($55-65K) $65K total comp package
EU Median ($45-55K) $60K total comp package
High Earners ($100K+) +10-15% US bonus/equity edge
Data & Methodology: This guide combines US wage anchors with directional European salary and labour-cost context, then normalizes examples into USD for comparison. Use it to frame cross-market tradeoffs, not as a precise country-by-country payroll calculator. Methodology
Primary Sources: BLS U.S. Wage Data · Eurostat Labour Market Statistics
Continue Your Salary Journey
See where your salary takes you next:
Income Percentile Calculator
US income percentile context
Take Home Pay Calculator
US net pay model
Average Salary by State 2026 — US salary data by state and industryFederal Tax Brackets 2026 — US tax burden contextCost of Living by State — Purchasing power within the US