
Average Salary by State 2026: What Workers Really Earn

Your salary doesn't exist in a vacuum. A $75,000 offer in Austin, Texas lands differently than the same offer in San Francisco — and understanding where your state sits in the national picture is the first step to knowing whether you're being paid fairly.
This guide uses the latest available Bureau of Labor Statistics (BLS) wage context and presents it as a 2026 planning view for mean annual wages, median wages, and estimated hourly rates across all 50 US states.
Why This Guide Exists On SalaryLabs
SalaryLabs uses this page to answer one broad market question: how high or low does a state sit in the national wage picture before you start judging a specific offer?
We keep this guide broad on purpose. State wage data is strong at the benchmark layer, but weak at the final-decision layer. That separation helps readers avoid the common mistake of treating a statewide average like a personal salary verdict.
How to Read State Salary Data Without Overreacting
State wage tables are useful, but they are easy to misuse. The most reliable reading order is:
- Start with state averages as a benchmark: this tells you whether your current market sits high, middle, or low relative to the rest of the country.
- Check median before assuming too much from mean: median wages usually give a cleaner read on what a more typical worker earns.
- Add industry and city context last: state-level data is broad. A software role in Seattle and a retail job in eastern Washington do not belong in the same mental benchmark.
Top 10 States by Mean Annual Wage — 2026 BLS Data — salarylabs.site View data table
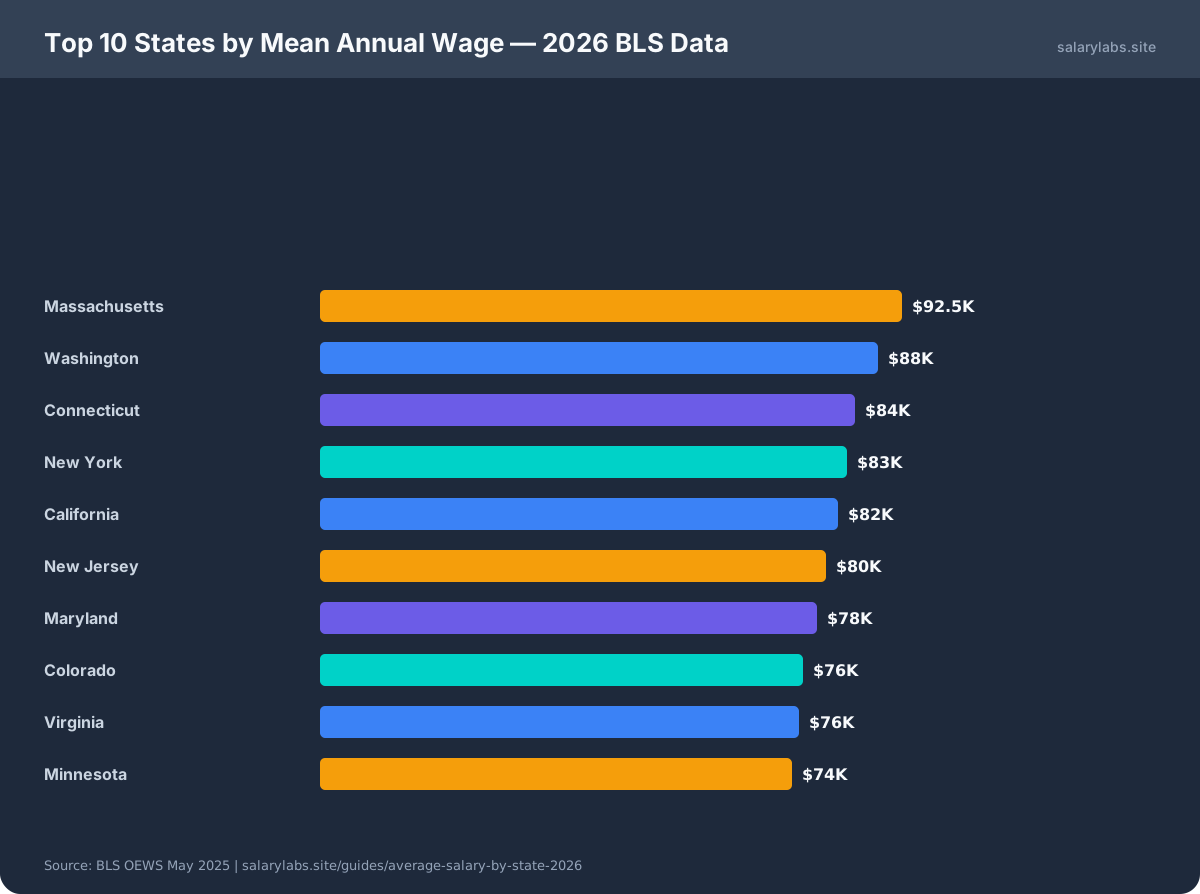
Top 10 States by Mean Annual Wage — 2026 BLS Data Rank Job / Category Value 1 Massachusetts 92480 2 Washington 88640 3 Connecticut 84930 4 New York 83750 5 California 82310 6 New Jersey 80440 7 Maryland 78930 8 Colorado 76820 9 Virginia 76110 10 Minnesota 74960
Top 10 States by Mean Wage in This 2026 Guide
View data table
| Rank | Job / Category | Value |
|---|---|---|
| 1 | Massachusetts | 92480 |
| 2 | Washington | 88640 |
| 3 | Connecticut | 84930 |
| 4 | New York | 83750 |
| 5 | California | 82310 |
| 6 | New Jersey | 80440 |
| 7 | Maryland | 78930 |
| 8 | Colorado | 76820 |
| 9 | Virginia | 76110 |
| 10 | Minnesota | 74960 |
The highest-paying states in this table tend to include large coastal labor markets and states with heavy exposure to finance, healthcare, biotech, and technology. That helps explain why Massachusetts, Washington, and Connecticut appear near the top.
| Rank | State | Mean Annual Wage | Median Annual Wage | Est. Hourly Rate |
|---|---|---|---|---|
| 1 | Massachusetts | $92,480 | $72,160 | $44.46 |
| 2 | Washington | $88,640 | $68,440 | $42.62 |
| 3 | Connecticut | $84,930 | $65,210 | $40.83 |
| 4 | New York | $83,750 | $62,440 | $40.27 |
| 5 | California | $82,310 | $63,790 | $39.57 |
| 6 | New Jersey | $80,440 | $62,180 | $38.67 |
| 7 | Maryland | $78,930 | $61,470 | $37.95 |
| 8 | Colorado | $76,820 | $60,340 | $36.93 |
| 9 | Virginia | $76,110 | $59,820 | $36.59 |
| 10 | Minnesota | $74,960 | $58,940 | $36.04 |
* State figures use the latest available BLS wage release and present it here as a 2026 planning view. Estimated hourly rates assume a standard 2,080-hour work year and are meant for broad comparison, not payroll quoting.
Bottom 10 States by Mean Wage in This Guide
Many of the lower-wage states in this table are in the South and parts of the Midwest. That does not automatically make them worse places to work or live. In several cases, lower housing and everyday costs can narrow the real-world gap between headline wages.
| Rank | State | Mean Annual Wage | Median Annual Wage | Est. Hourly Rate |
|---|---|---|---|---|
| 41 | Idaho | $52,640 | $43,180 | $25.31 |
| 42 | Montana | $51,870 | $42,690 | $24.94 |
| 43 | South Dakota | $51,240 | $41,830 | $24.63 |
| 44 | Oklahoma | $50,880 | $41,340 | $24.46 |
| 45 | Louisiana | $50,430 | $40,960 | $24.24 |
| 46 | New Mexico | $50,120 | $40,610 | $24.10 |
| 47 | Alabama | $49,670 | $40,230 | $23.88 |
| 48 | West Virginia | $47,320 | $38,840 | $22.75 |
| 49 | Arkansas | $47,090 | $38,610 | $22.64 |
| 50 | Mississippi | $44,680 | $36,920 | $21.48 |
All 50 States — State Wage Benchmarks in This 2026 Guide
| State | Mean Annual | Median Annual | Est. Hourly |
|---|---|---|---|
| Alabama | $49,670 | $40,230 | $23.88 |
| Alaska | $66,910 | $54,480 | $32.17 |
| Arizona | $62,840 | $50,620 | $30.21 |
| Arkansas | $47,090 | $38,610 | $22.64 |
| California | $82,310 | $63,790 | $39.57 |
| Colorado | $76,820 | $60,340 | $36.93 |
| Connecticut | $84,930 | $65,210 | $40.83 |
| Delaware | $68,240 | $54,960 | $32.81 |
| Florida | $59,430 | $47,580 | $28.57 |
| Georgia | $63,810 | $51,470 | $30.68 |
| Hawaii | $65,480 | $53,040 | $31.48 |
| Idaho | $52,640 | $43,180 | $25.31 |
| Illinois | $72,390 | $57,840 | $34.80 |
| Indiana | $57,220 | $46,470 | $27.51 |
| Iowa | $56,830 | $46,040 | $27.32 |
| Kansas | $56,440 | $45,780 | $27.13 |
| Kentucky | $53,680 | $43,780 | $25.81 |
| Louisiana | $50,430 | $40,960 | $24.24 |
| Maine | $57,960 | $47,150 | $27.87 |
| Maryland | $78,930 | $61,470 | $37.95 |
| Massachusetts | $92,480 | $72,160 | $44.46 |
| Michigan | $60,840 | $49,360 | $29.25 |
| Minnesota | $74,960 | $58,940 | $36.04 |
| Mississippi | $44,680 | $36,920 | $21.48 |
| Missouri | $57,640 | $46,820 | $27.71 |
| Montana | $51,870 | $42,690 | $24.94 |
| Nebraska | $57,030 | $46,230 | $27.42 |
| Nevada | $59,820 | $48,130 | $28.76 |
| New Hampshire | $66,380 | $53,940 | $31.92 |
| New Jersey | $80,440 | $62,180 | $38.67 |
| New Mexico | $50,120 | $40,610 | $24.10 |
| New York | $83,750 | $62,440 | $40.27 |
| North Carolina | $60,270 | $48,790 | $28.98 |
| North Dakota | $56,190 | $45,620 | $27.02 |
| Ohio | $59,680 | $48,310 | $28.69 |
| Oklahoma | $50,880 | $41,340 | $24.46 |
| Oregon | $67,340 | $54,610 | $32.38 |
| Pennsylvania | $66,920 | $53,950 | $32.17 |
| Rhode Island | $68,730 | $55,340 | $33.05 |
| South Carolina | $54,390 | $44,180 | $26.15 |
| South Dakota | $51,240 | $41,830 | $24.63 |
| Tennessee | $55,810 | $45,320 | $26.83 |
| Texas | $64,730 | $52,180 | $31.12 |
| Utah | $63,480 | $51,210 | $30.52 |
| Vermont | $59,170 | $48,020 | $28.45 |
| Virginia | $76,110 | $59,820 | $36.59 |
| Washington | $88,640 | $68,440 | $42.62 |
| West Virginia | $47,320 | $38,840 | $22.75 |
| Wisconsin | $59,940 | $48,620 | $28.82 |
| Wyoming | $57,470 | $46,610 | $27.63 |
High Wage ≠ High Purchasing Power
The most important context missing from raw salary data is cost of living. California's average $82,310 wage sounds impressive until you factor in that San Francisco median rent exceeds $3,200/month — roughly $38,400/year before food, transport, or taxes.
Compare that to, say, Kansas ($56,440 average wage, median rent ~$1,050/month). The wage gap is real, but the gap in discretionary income after essentials is much smaller.
The Salary Heatmap shows real purchasing power for your salary across all 50 states — not just the nominal figure.
How to Use This Data
These figures work best as a benchmark, not as a prediction. Industry, experience, education, and role level still shape actual offers. Use the averages to:
- Benchmark your current pay against state-level wage context before assuming you are above or below market
- Evaluate relocation offers with cost-of-living context, especially when a nominal raise looks smaller after housing and taxes
- Prepare for salary discussions with market references instead of relying only on anecdotal ranges
- Understand why remote-work pay policies may vary by labor market and local cost structure
What State Data Cannot Tell You
This guide is broad by design. It cannot answer the narrower questions that usually matter most in a real job decision:
- It does not price your occupation precisely: engineers, nurses, teachers, and warehouse workers live inside very different wage distributions in the same state.
- It does not solve city-level housing pressure: state averages can hide a major difference between one expensive metro and the rest of the state.
- It does not convert into take-home pay: taxes, payroll deductions, and benefits still need to be modeled separately.
Average Salary by Industry (All States, 2026)
State averages mask enormous variation by industry. These rows are broad national industry anchors, not state-specific industry quotes, so they work best as directional context alongside state data:
| Industry | Avg Annual Wage | Typical Range |
|---|---|---|
| Securities & Financial Services | ~$165,000 | $75K–$300K+ |
| Software & Technology | ~$138,000 | $85K–$250K |
| Healthcare (Physicians) | ~$220,000 | $150K–$400K+ |
| Legal Services | ~$112,000 | $55K–$250K |
| Engineering | ~$105,000 | $65K–$180K |
| Education (K-12) | ~$65,000 | $42K–$95K |
| Retail Trade | ~$42,000 | $28K–$75K |
| Food Services & Restaurants | ~$32,000 | $25K–$55K |
* Industry rows are broad editorial ranges built around national wage context, not a single-source state-by-state industry dataset. Use them as comparison anchors only.
Methodology & Data Sources
All wage data is sourced from the Bureau of Labor Statistics (BLS) Occupational Employment and Wage Statistics (OEWS) program, which surveys over 1.1 million business establishments. Mean annual wages are calculated across all occupations combined. Hourly rates assume a standard 2,080-hour work year. Data reflects the most recent BLS release and is presented here as a 2026 planning view. Industry examples and housing references are added as editorial comparison context rather than official state-level wage releases.