Independent Salary Data Researcher
Published Jan 15, 2026
Updated Jul 21, 2026
Maintained by the author using IRS Publication 15-T, SSA wage-base announcements, and BLS OEWS data.
All calculator formulas are deterministic JavaScript — no AI inference in the numbers.
Content is reviewed for accuracy when tax figures are updated annually. See Methodology · Author Profile
Teacher salary headlines hide the part that matters most: where you work, how long you stay,
and how your pension and taxes change the value of the job. Gross pay can look strong in one
state and still lose badly on housing or after-tax cash flow in another.
Best way to use this guide: start with the state salary benchmark. Then pressure-test it against your district pay lane, pension vesting, and actual take-home pay. This page works best as a planning workflow, not as a promise of what one district will offer.
$74K
National avg teacher salary — directional benchmark
National avg: ~$74,000/year = $35.58/hour = $2,846/bi-weekly gross
Est. take-home (single, avg. state tax): ~$56,000/year or ~$2,154/bi-weekly
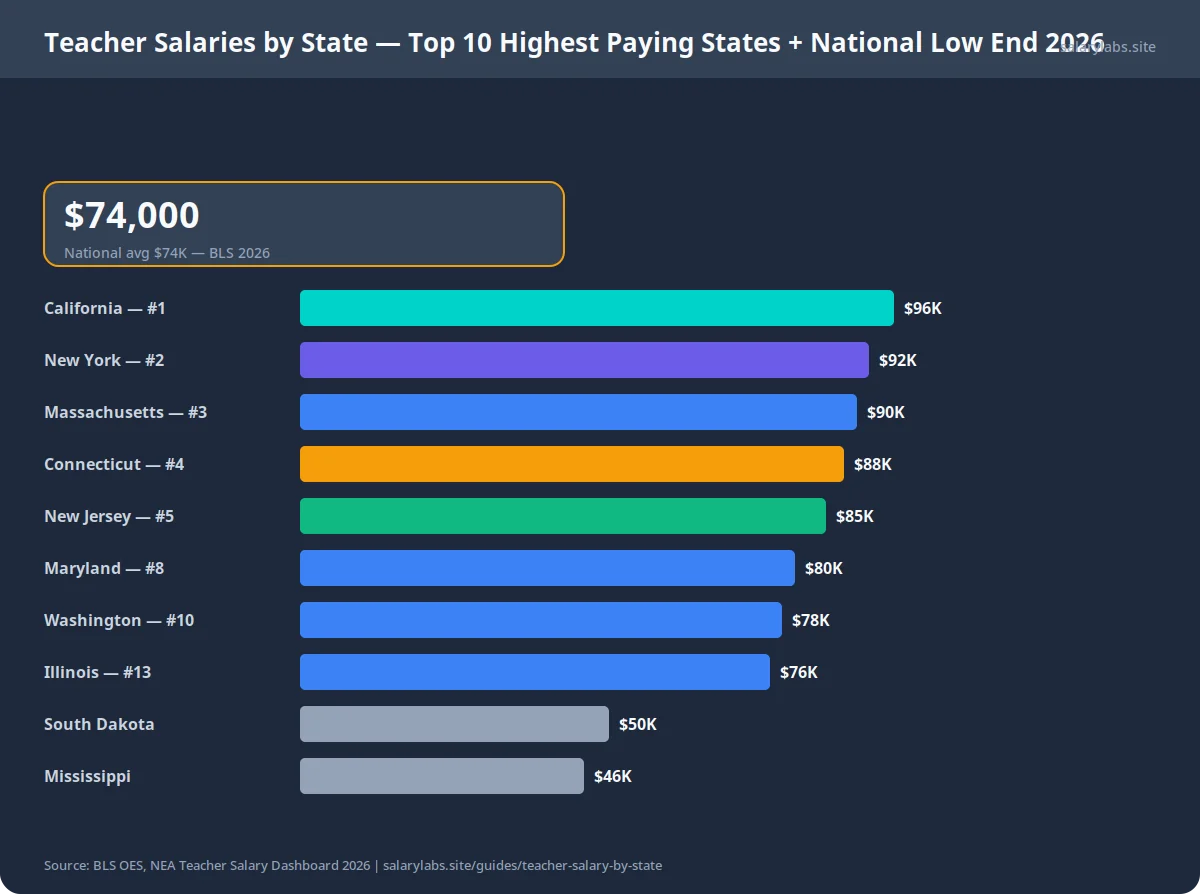
Teacher Salaries by State — Top 10 + National Low End 2026 — salarylabs.siteView data table
Teacher Salaries by State — Top 10 Highest Paying States + National Low End 2026
Rank
Job / Category
Value
1
California — #1
96000
2
New York — #2
92000
3
Massachusetts — #3
90000
4
Connecticut — #4
88000
5
New Jersey — #5
85000
6
Maryland — #8
80000
7
Washington — #10
78000
8
Illinois — #13
76000
9
South Dakota
50000
10
Mississippi
46000
Teacher Salary by State: 2026 Planning View
~$74KNational average teacher salary (2026 planning view)
CA/NYHighest-paying states for public school teachers
PensionKey benefits component often worth 15–20% of salary
State
Avg. Annual Salary
Avg. Hourly
Rank
California
$96,000
$46.15
#1
New York
$92,000
$44.23
#2
Massachusetts
$90,000
$43.27
#3
Connecticut
$88,000
$42.31
#4
New Jersey
$85,000
$40.87
#5
Maryland
$80,000
$38.46
#8
Washington
$78,000
$37.50
#10
Illinois
$76,000
$36.54
#13
Texas
$62,000
$29.81
#32
Florida
$58,000
$27.88
#38
South Dakota
$50,000
$24.04
#46
Mississippi
$46,000
$22.12
#50
* Public-school salary ranges are read here as a 2025–2026 planning view using NEA and BLS context. They are useful for benchmarking school-pay structures, not as a district-specific contract quote.
Free Calculator
See what your teacher salary actually takes home after taxes
Enter your state + salary — get federal, state & FICA breakdown in seconds
Experience is the most predictable salary lever in public education. Most districts run on fixed salary schedules — a grid of lanes (education level) and steps (years of service). Movement along the grid is largely automatic, which makes teaching one of the few US professions where salary growth is highly transparent and predictable in advance.
How to read your salary schedule: Find your lane (BA, BA+30, MA, MA+30, doctorate) and your step (years of credited service). The intersection is your base salary. Lane changes require documented coursework or degree completion — they do not happen automatically.
Years of Experience
Salary Range
Notes
0–3 years (starting)
$38,000 – $52,000
Entry on salary schedule
4–9 years
$50,000 – $68,000
Step increases annually
10–19 years
$64,000 – $85,000
Mid-career with Master's
20+ years
$80,000 – $110,000
Top of salary schedule
Teacher Total Compensation: Beyond the Salary
Teacher salaries do not tell the whole story. Benefits, pension formulas, and job security
can change the value of the role materially, but the value is not distributed evenly:
Defined-benefit pension: often the biggest long-term differentiator, especially for teachers who remain in one system for many years.
Health insurance: district coverage can narrow the gap with private-sector salaries, but plan generosity varies widely.
Summer schedule: Approximately 10–11 weeks off annually (though most teachers use this for professional development, curriculum planning, or second jobs)
Job security: Tenure after 2–3 years provides strong employment protection
Loan forgiveness: PSLF can be meaningful for eligible teachers with federal student debt, but it depends on program rules and service history.
Salary alone is a weak comparison tool for teaching jobs. Pension vesting, district benefits, and local housing costs can shift the real value faster than a simple gross-pay ranking.
Teacher Take-Home Pay After Taxes
Most teachers pay federal income tax, FICA, and state income tax. Some states exempt teacher
pensions from state income tax, which improves retirement income significantly. Here's a
realistic net pay estimate for a single teacher earning $70,000/year in a moderate-tax state:
$70,000 gross
− $16,100 standard deduction = $53,900 taxable
− $6,570 federal income tax (est.)
− $5,355 FICA (7.65%)
− $2,156 state income tax (approx. 4% effective)
= ~$55,919 take-home (~$2,151/bi-weekly)
Teacher pay is usually governed by district schedules, but there are still a few levers that materially change earnings over time:
Advanced degrees: many districts offer permanent lane increases for a master's or doctorate, which matter most when the added pay compounds across a long career.
National Board Certification: some states and districts attach meaningful annual stipends to NBCT, while others do very little with it.
Coaching and extracurriculars: stipends can create real income lift, but the range depends heavily on district budget and assignment.
Summer curriculum work: paid summer assignments can add income without requiring a full second job.
Leadership roles: department chair, mentor, or instructional-coach roles often raise earnings more reliably than hoping for discretionary negotiation.
Placement and experience credit: teachers changing districts should check how prior years of service are credited before accepting an offer.
Teacher Salary vs Similar Professions
Profession
Avg Salary
Job Security
Pension
Summers Off
Public School Teacher
~$73,000
High (tenure)
Strong (DB plan)
Yes (paid)
Social Worker
~$58,000
Moderate
Variable
No
Librarian
~$65,000
Moderate
Variable
No
School Counselor
~$72,000
High
Strong
Often
Corporate Trainer
~$75,000
Lower
401k only
No
College Professor
~$95,000
High (tenure)
Strong
Yes
ProfessionAvg SalaryPension
Social Worker$58KVariable
Librarian$65KVariable
School Counselor$72KStrong
Public School Teacher ←$73KStrong DB
Corporate Trainer$75K401k only
College Professor$95KStrong
The Teacher Pay Rule
State + pension + lane — those three move total teacher compensation more than gross salary alone.
A California teacher at $96K and a Mississippi teacher at $46K are in completely different
financial realities. But a Mississippi teacher with a strong defined-benefit pension and
low cost of living may retire more comfortably than a high-grossing California teacher
with high rent and a weaker pension. Total compensation requires all three layers.
What is the average teacher salary in the US in 2026?
National teacher pay is usually discussed in the low-to-mid $70,000 range, but the more useful comparison is state by state. Funding, pension structure, and cost of living create a much wider spread than the national average suggests.
Which state pays teachers the most?
Large coastal states such as California and New York often post the highest gross teacher salaries. That does not automatically make them the strongest take-home markets once rent, taxes, and pension rules are included.
Do teachers get summers off without pay?
No — most teachers' annual salaries are distributed across 12 equal monthly payments, even though the school year runs approximately 10 months. Teachers receive full pay year-round. Some districts give teachers the option to receive their salary over 10 months (at a higher monthly amount) or 12 months (smoother budgeting).
How do teacher pensions affect total compensation?
Pensions can materially change the value of a teaching job, especially for long-tenure teachers in strong state systems. Their value drops quickly if you leave before vesting or move between systems with weak portability.
Can teachers negotiate their salary?
Usually not in the private-sector sense. Most districts use fixed salary schedules, but teachers can still negotiate starting step placement, credit for prior experience, or stipends tied to extra duties.
Put the teacher salary data above to work: benchmark your pay against your state average, compare public vs private school ranges, or see where your pension and take-home stack up.
Teacher pay is clearest when you separate salary schedule, pension value, taxes, and location. Use these next steps to translate the benchmark into your own take-home context.
Data & Methodology: This guide uses public teacher-pay references from BLS and NEA, then translates those figures into state-by-state salary context and simple take-home illustrations. Use it to compare school-pay structures, not to estimate your contract down to the dollar. Methodology