
Wage Growth vs Inflation 2020-2026: The Cumulative Pay Cut

A 4% raise feels like progress. In an inflation environment where the consumer price index rose 6%, that raise is a 2-point real-wage decline — the paycheck grew, the purchasing power shrank. Most coverage of wages and inflation is annual: the latest jobs report, the latest CPI release, a single-year delta. This guide does the cumulative math instead, the version that matters more for how a worker has actually lived.
Source data is the Bureau of Labor Statistics: Average Hourly Earnings of all private-sector employees (Series CES0500000003) and CPI-U All Urban Consumers, both on an annual-average basis from 2020 through 2026. All references are linked at the end of the guide.
What this guide is. A year-by-year and cumulative comparison of nominal wage growth against CPI-U inflation across the 2020-2026 period. What it is not. A forecast, an investment recommendation, or a substitute for personal financial planning.
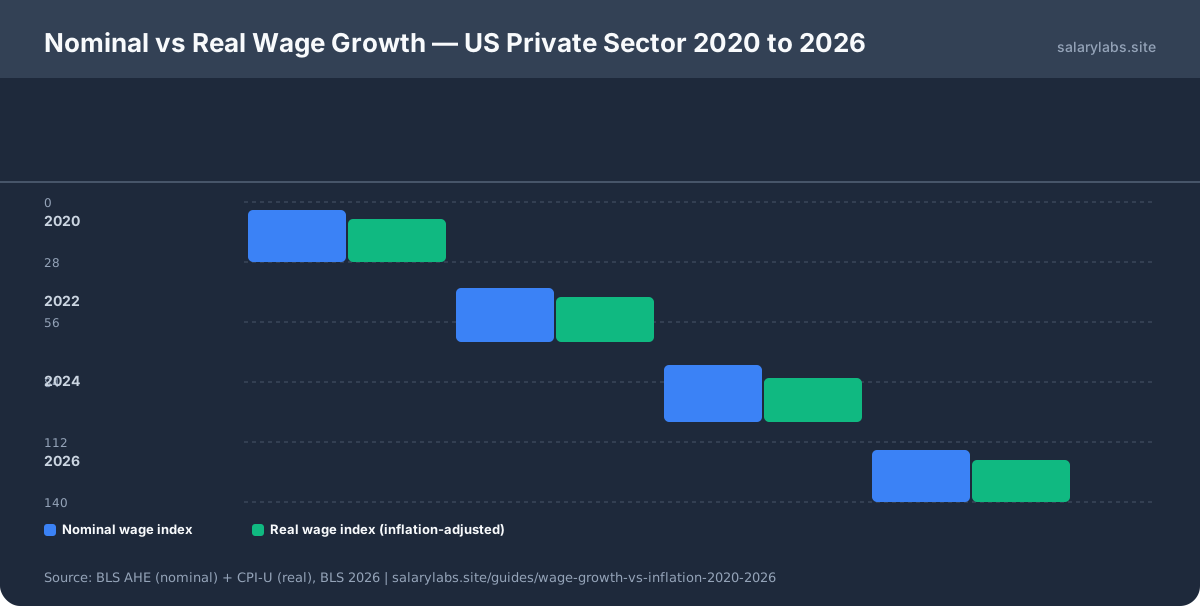
Base: January 2020 = 100. Nominal: BLS AHE Series CES0500000003. Real: CPI-U All Urban Consumers. Source: Bureau of Labor Statistics.
The Methodology in One Paragraph
For each year, the guide takes the annual-average value of average hourly earnings (private
sector, total) and the annual-average value of CPI-U. Real wage growth in year N is computed
as (1 + nominal growth) ÷ (1 + CPI growth) − 1. Cumulative real-wage position is
the running product of those single-year factors, anchored at January 2020 = 100. The result
is a single number per year that says "$1.00 of January-2020 purchasing power is now worth
$X.XX in real terms."
Two reasons to use CPI-U rather than a narrower index. First, it covers the broadest US population (urban consumers, roughly 93% of the country). Second, it is the same series the Social Security Administration uses for COLA adjustments — so the comparison aligns with the benefits framework most retired workers actually live on. CPI-W (urban wage earners) is also defensible; the choice does not change the direction of the result, only marginally affects magnitude.
The Year-by-Year Picture
| Year | Nominal wage growth BLS CES (Monthly) verified 2026-07-31 | CPI-U change BLS CPI-U (Monthly) verified 2026-07-31 | Real wage growth | Index (Jan 2020 = 100) |
|---|---|---|---|---|
| 2020 | +4.7% | +1.2% | +3.5% | 103.5 |
| 2021 | +4.8% | +4.7% | +0.1% | 103.6 |
| 2022 | +5.4% | +8.0% | −2.4% | 101.1 |
| 2023 | +4.5% | +4.1% | +0.4% | 101.5 |
| 2024 | +4.0% | +2.9% | +1.1% | 102.6 |
| 2025 Est. | +3.8% | +2.9% | +0.9% | 103.5 |
| 2026 Proj. | +3.5% | +2.5% | +1.0% | 104.5 |
Reading this table top to bottom: the average private-sector worker entered 2020 with rising real wages, gave most of it back in 2021 as inflation accelerated, lost ground meaningfully in 2022, then began clawing back in 2023-2026. The cumulative position by 2026 is roughly +4.5% real, meaning the average private-sector wage today buys about 4.5% more than the same wage did in January 2020.
That is the headline number used in optimistic coverage. It is true. It also misses two things that matter. First, the path: workers experienced a sustained period of real-wage decline in 2021-2022 that meaningfully shaped budgets, and recovery has been gradual rather than decisive. Second, the average masks the distribution.
The Distribution: Who Absorbed the Losses
Average wage growth and average inflation describe the average worker. Real life happens at specific income deciles and specific industries. BLS publishes earnings by occupation group and by income decile, and the picture is uneven.
Lower-decile workers experienced larger nominal wage gains during the 2021-2024 period, partly because the federal and several state minimum-wage rates were rising and partly because labour-market tightness gave hourly workers more bargaining power than they had pre-2020. By the end of 2024, real wages for the bottom 20% of earners had fully recovered and exceeded January 2020 levels. The middle 40-60% range largely tracked the average. The top 20% of earners experienced smaller percentage gains and, in real terms, ended 2024 roughly flat against 2020.
Industry composition matters too. Hospitality, leisure, and retail saw the largest percentage wage gains over the period, partly recovering from the 2020 base. Information, finance, and professional services saw smaller percentage gains because they had not declined sharply during 2020. Reading "wages went up" without disaggregating sector and decile produces a misleading single-line summary.
Why the Cumulative Number Is Different from the Annual
A reader scanning year-by-year deltas might compute a quick mental sum: −2.4% in 2022, +0.4% in 2023, +1.1% in 2024, etc., totalling approximately +4.6%. The actual compounded number is +4.5%, very close. But for a worker in a sector or decile that did not match the average, the compounding works in the opposite direction and the gap can widen quickly.
Example: a worker whose real wage path was 0%, −3%, −1%, 0%, +1%, +1% across 2020-2025 ends the period at index 97.97 — about a 2% real-wage decline cumulatively. Each individual year looked like a small movement; the compounded effect is a measurable purchasing-power loss. This is the math that produces the lived experience of "my paycheck went up but my budget got tighter." The numbers are not contradicting; they are describing two different things.
Sector Snapshot: 2020-2026 Real Wage Position
Index values at end of 2026, January 2020 = 100. Values are derived from BLS sector-level Average Hourly Earnings deflated by CPI-U. Approximate; precise values shift with each BLS revision.
| Sector | Real wage index (2026) Est. | Cumulative real change Est. |
|---|---|---|
| Leisure & hospitality | 112.4 | +12.4% |
| Retail trade | 108.1 | +8.1% |
| Construction | 105.7 | +5.7% |
| Transportation & warehousing | 105.2 | +5.2% |
| Manufacturing | 103.8 | +3.8% |
| Education & health services | 102.9 | +2.9% |
| Professional & business services | 101.4 | +1.4% |
| Information | 99.8 | −0.2% |
| Financial activities | 99.5 | −0.5% |
Information and financial activities are the two sectors where real wages ended the period below January 2020 levels. Both had high nominal wages going into 2020, smaller percentage raises during 2021-2024, and bore the full weight of 2022 inflation. The leisure-hospitality and retail figures are partly a recovery from a low 2020 base; reading them as "the worker is thriving" overstates the picture in absolute terms.
What 2026 Looks Like
Through the latest BLS release of 2026, year-over-year nominal wage growth is running near 3.5% and CPI-U is running near 2.5%, producing approximately +1.0% real wage growth. That pace, if sustained for a full calendar year, would lift the cumulative real-wage index from 103.5 at end-2025 to approximately 104.5 at end-2026. Sustaining it depends on three things: labour-market tightness staying near current levels, services inflation continuing its gradual decline, and no external shock to energy or food prices.
None of those are guaranteed. The historical record across 2020-2026 shows that single-year shocks can erase several years of slow gains. A worker who wants to think about this honestly should treat real-wage growth as a multi-year average expectation, not as a single-year entitlement.
How to Use This Number in Compensation Conversations
Three honest applications for workers and managers, none of them advisory.
First, the directional reference. A nominal raise that matches CPI-U is, by definition, a flat real outcome. A raise of 5% in a year of 3% inflation is a real-wage gain of about 1.9%. A raise of 3% in a year of 5% inflation is a real-wage loss of about 1.9%. The CPI number is not a wage minimum; it is a baseline above which a raise represents real progress and below which it represents real decline.
Second, the multi-year frame. A worker comparing offers between two paths can use the cumulative real-wage table to set expectations honestly. If sector A has historically delivered +1% real per year and sector B has historically delivered −0.3% real per year, that gap compounds into a meaningful wage-trajectory difference over a 5-10 year horizon, even when single-year nominal numbers look similar.
Third, the budget-anchor. A household that experienced 2022's −2.4% real-wage shock should not assume a single 2024 raise of 4% closes the gap. The compounded position matters more than any single year's recovery.
Limitations
- Average vs. individual. The numbers describe the BLS aggregate. An individual worker's wage path can diverge substantially. A worker who changed jobs, industries, or geographies during the period will not match the average regardless of how the average moved.
- CPI-U vs. personal inflation. CPI-U weights the average urban consumer basket. A specific household's basket — heavier on rent, healthcare, or childcare — can produce a personal inflation rate materially above or below CPI-U. The methodology section of the BLS publication explains the basket weights for those who want to compute a personal adjustment.
- Total compensation vs. wages. The series tracks hourly earnings, not total compensation. Employer healthcare contributions, 401(k) match increases, and other non-wage compensation are excluded. For workers whose benefits expanded over the period, the total compensation picture is materially better than the wage-only picture.
- Tax effect. The series is pre-tax. After-tax real wages depend on bracket creep, the size of the standard deduction relative to inflation (which the IRS adjusts annually), and changes in state tax rules. The pre-tax view is the cleanest comparison across the period.
- Hours worked. The series is per-hour. Workers who lost hours in 2020 and then regained them experienced a different income path than the per-hour series implies.
Related Tools and Guides
- Salary Time Machine — adjust any salary across any pair of years using BLS CPI annual averages
- Income Percentile Calculator — see where a given income lands in the national distribution
- Salary Comparison Tool — compare against US and international peer ranges
- Take-Home Pay Calculation Guide — the after-tax counterpart to this pre-tax view
- Real Take-Home Pay by State 2026 — the cross-sectional companion to this longitudinal view
How the real-wage index was computed
Cumulative real-wage position relative to January 2020 for the US private-sector worker. Index = 100 at Jan 2020 baseline.
Nominal wage: BLS AHE Series CES0500000003, annual average. Inflation: BLS CPI-U All Urban Consumers, annual average. Real wage growth in year N = (1 + nominal growth) ÷ (1 + CPI growth) − 1. Cumulative index = running product of single-year real-growth factors, anchored at Jan 2020 = 100.
BLS Current Employment Statistics (AHE) + BLS CPI-U. Sector data from BLS CES industry detail tables.
Annual averages used (not monthly peak/trough). CPI-U chosen over CPI-W because it covers ~93% of US population and aligns with SSA COLA framework. Real wage series is pre-tax hourly earnings — does not account for benefits, hours changes, or job switching.
Does not capture total compensation (benefits, equity, 401k match). CPI-U is an average urban basket — individual household inflation can diverge materially. Aggregate data masks sector, occupation, and income-decile dispersion. 2025 and 2026 figures are preliminary estimates; BLS revisions can shift historical values.
Sources
- Average Hourly Earnings, Total Private (Series CES0500000003): BLS Current Employment Statistics BLS CES (Monthly) verified 2026-07-31
- Consumer Price Index for All Urban Consumers (CPI-U): BLS CPI Home BLS CPI-U (Monthly) verified 2026-07-31
- Sector-level wage data: BLS CES industry detail tables
- Earnings distribution by decile: BLS Current Population Survey BLS CPS (Monthly) verified 2026-07-31